
Basic Interpretation of Risk — Standard Deviation
What is Meant by “Risk” Here?
Risk in returns is the amount of variability around an asset’s typical (average) return. The wider and more frequent the swings away from the average, the riskier the asset is considered to be.
Standard Deviation as a Measure of Risk
An asset’s total risk is measured through the standard deviation of the distribution of its returns. A higher standard deviation means outcomes tend to stray further from the average; a lower standard deviation means outcomes cluster more tightly around the average.
- High standard deviation: larger, less predictable ups and downs.
- Low standard deviation: steadier performance around the average.
Many classroom interpretations rely on the normal-distribution approximation to translate standard deviation into “how often” returns fall within certain ranges.
Variance & Standard Deviation — Background, Examples
1) What these measures capture
Variance and standard deviation summarize how widely returns scatter around their average. If returns swing far above and below the average, the variance is large and the standard deviation is high; if returns hug the average, both are low.
2) Background: variance vs. standard deviation
- Variance averages the squared deviations from the mean. Squaring penalizes big surprises more than small ones and ensures the measure is never negative.
- Standard deviation is the square root of variance. It brings the units back to “% return,” making it easier to interpret as overall volatility.
- Normal-range rule of thumb (approximation): about 68% of outcomes fall within ±1 standard deviation of the mean, about 95% within ±2, about 99.7% within ±3.
3) Estimation choices you should state
- Sample vs. population: with historical data we usually report the sample standard deviation (denominator
n−1). - Periodicity: specify whether you used daily, monthly, or annual returns. If returns are roughly independent, an annualized standard deviation can be approximated by
σ_annual ≈ sqrt(12) × σ_monthly(and variance by12 × Var_monthly). - Arithmetic vs. log returns: be consistent; standard deviation differs slightly depending on the return definition.
4) Example with Two Stocks
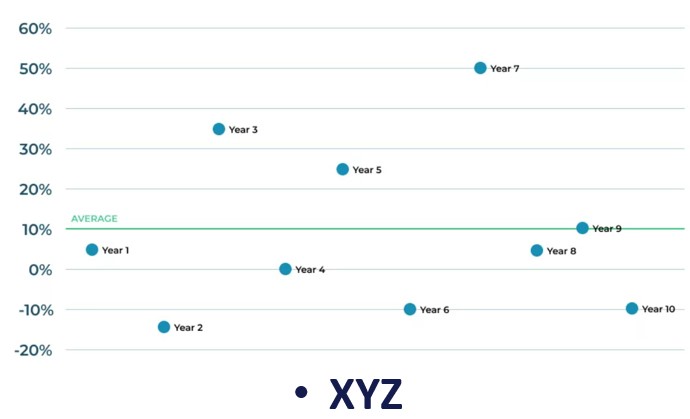
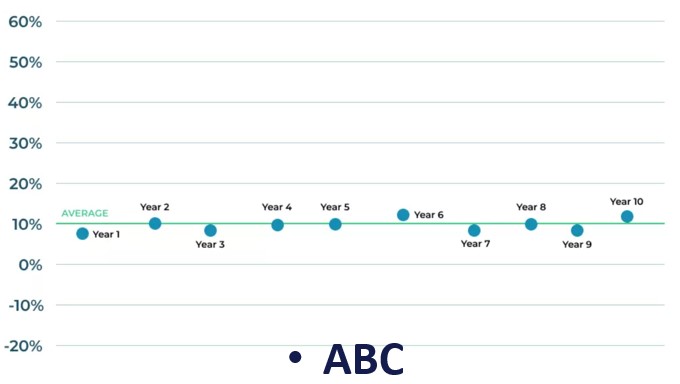
Average return for both stocks over the last 10 years: 10%.
Stock XYZ (more volatile): The return is expected to be 10%, but about 68% of the time it could be as high as 30% or as low as −10%. This wide range indicates a relatively high standard deviation.
Stock ABC (less volatile): Using the same process, the standard deviation is much lower, about 1.29%. Returns tend to stay close to the 10% average, reflecting lower total risk.
5) How to Use Standard Deviation
- Compare risk across assets: higher standard deviation implies greater uncertainty around expected returns.
- Set expectations: pair the average return with the standard deviation to describe a plausible range for outcomes over typical periods.
- Portfolio design: combine assets with different volatilities and co-movements to balance risk and return.
6) Practical caveats
- Not all risk is symmetric: standard deviation treats upside and downside equally. For downside focus, consider semideviation or drawdown metrics.
- Fat tails and clustering: real markets can have more extreme moves and volatility regimes than the normal approximation suggests; ranges like “±1σ covers 68%” may understate tails.