
Risk & Return — One Risky Asset with One Risk-Free Asset, plus SML vs CML

1) Core Principle: Risk and Return
Risk and return move together. Investors are generally risk-averse, so they require a higher expected return to hold more risk. Diversification can reduce many security-specific risks, but it cannot remove broad market forces that move many assets together.
2) A Portfolio with One Risky Asset and One Risk-Free Asset
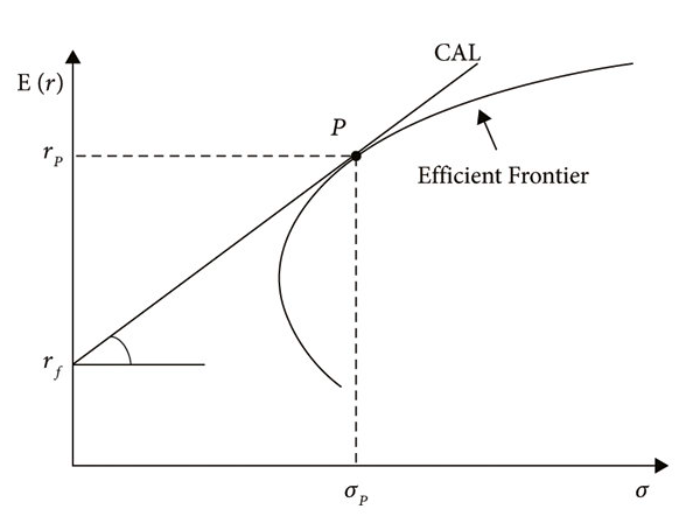
Combine a single risky asset with a risk-free asset such as a short-term government bill. The weight on the risky asset determines both the portfolio’s expected return and its volatility. Weights greater than one imply borrowing at the risk-free rate to lever up the risky position.
- Linearity of expected return: as the risky weight rises, expected return increases proportionally from the risk-free rate toward the risky asset’s expected return (and beyond with leverage).
- Proportional growth of volatility: portfolio risk rises in step with the risky weight.
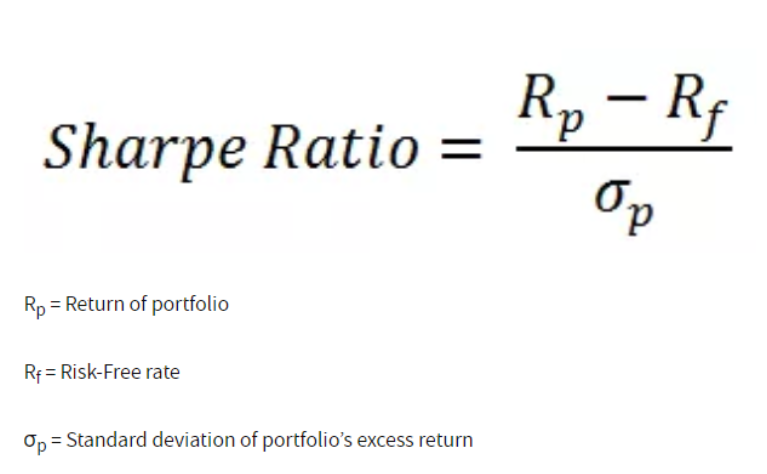
- Constant trade-off: the extra expected return per unit of extra risk is constant along this mix; that constant is the asset’s Sharpe ratio.
- Lending vs borrowing: positive weight in the risk-free asset means lending; negative weight means borrowing to increase exposure to the risky asset.
- Dominance: if one risky asset has a higher Sharpe ratio than another, every mix with it offers a better risk–return trade-off.
This straight-line opportunity set is the investor’s Capital Allocation Line (CAL) for that particular risky asset. Different risky assets produce different CALs; the best one has the highest slope (Sharpe ratio).


3) SML vs CML
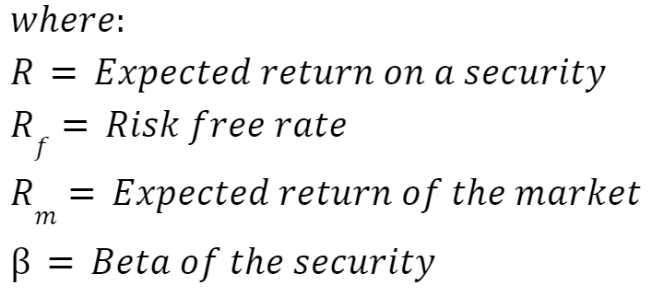
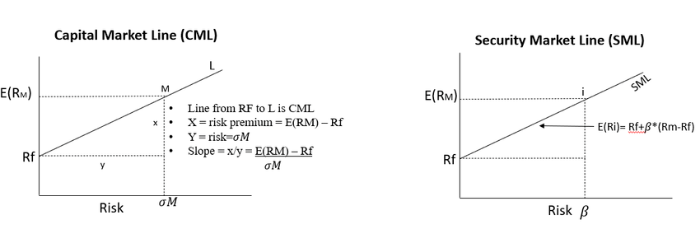
Security Market Line (SML): plots expected return against beta (systematic risk) for any asset or portfolio. It shows the required return for bearing market-wide risk. Points above the SML suggest more return than required (positive alpha); points below suggest less.
Capital Market Line (CML): plots expected return against total volatility for efficient portfolios formed by mixing the risk-free asset with the market portfolio. Individual securities generally do not lie on the CML because they contain diversifiable risk.
| Feature | SML | CML |
|---|---|---|
| X-axis | Beta (systematic risk) | Total volatility (standard deviation) |
| Y-axis | Expected return | Expected return |
| What it prices | All assets via required return for market risk | Efficient portfolios from risk-free + market portfolio |
| Interpretation | Above: potentially undervalued; Below: potentially overvalued | Any point on the line is achievable by lending/borrowing and holding the market portfolio |
| Risk concept | Systematic risk only | Total risk (systematic + diversifiable) |
Connection to Section 2: when the single risky asset you mix with the risk-free asset is the market portfolio, your CAL becomes the CML. The SML, in contrast, is used to evaluate whether an individual asset’s expected return is appropriate for its beta.
4) Practical Pointers
- State assumptions: no transaction costs, identical information, and the ability to borrow/lend at the risk-free rate are typical simplifying assumptions.
- Identify the risky object: if the single risky asset is not the market portfolio, the line you draw is a personal CAL, not the CML.
- Separate risks: use total volatility when thinking about the CML; use beta when judging assets against the SML.
- Leverage language: “borrow to invest” means a negative weight in the risk-free asset and a weight above one in the risky asset; both expected return and volatility rise.